Setting log options
Use the Logs settings of a run/debug configuration to show log files in separate tabs of the Run and Debug tool windows.
Configure options for logs
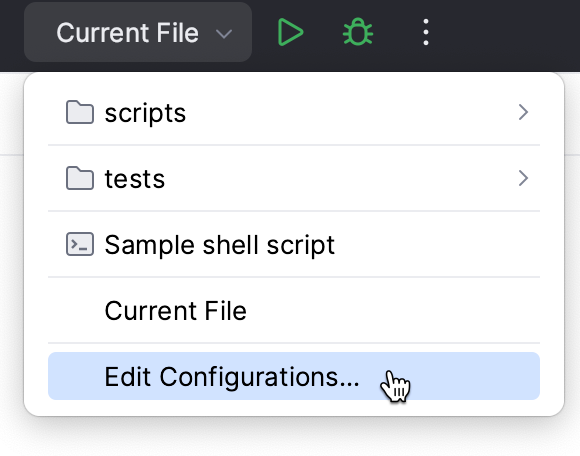
Go to . Alternatively, click
 in the Run widget and select Edit Configurations from the drop-down menu.
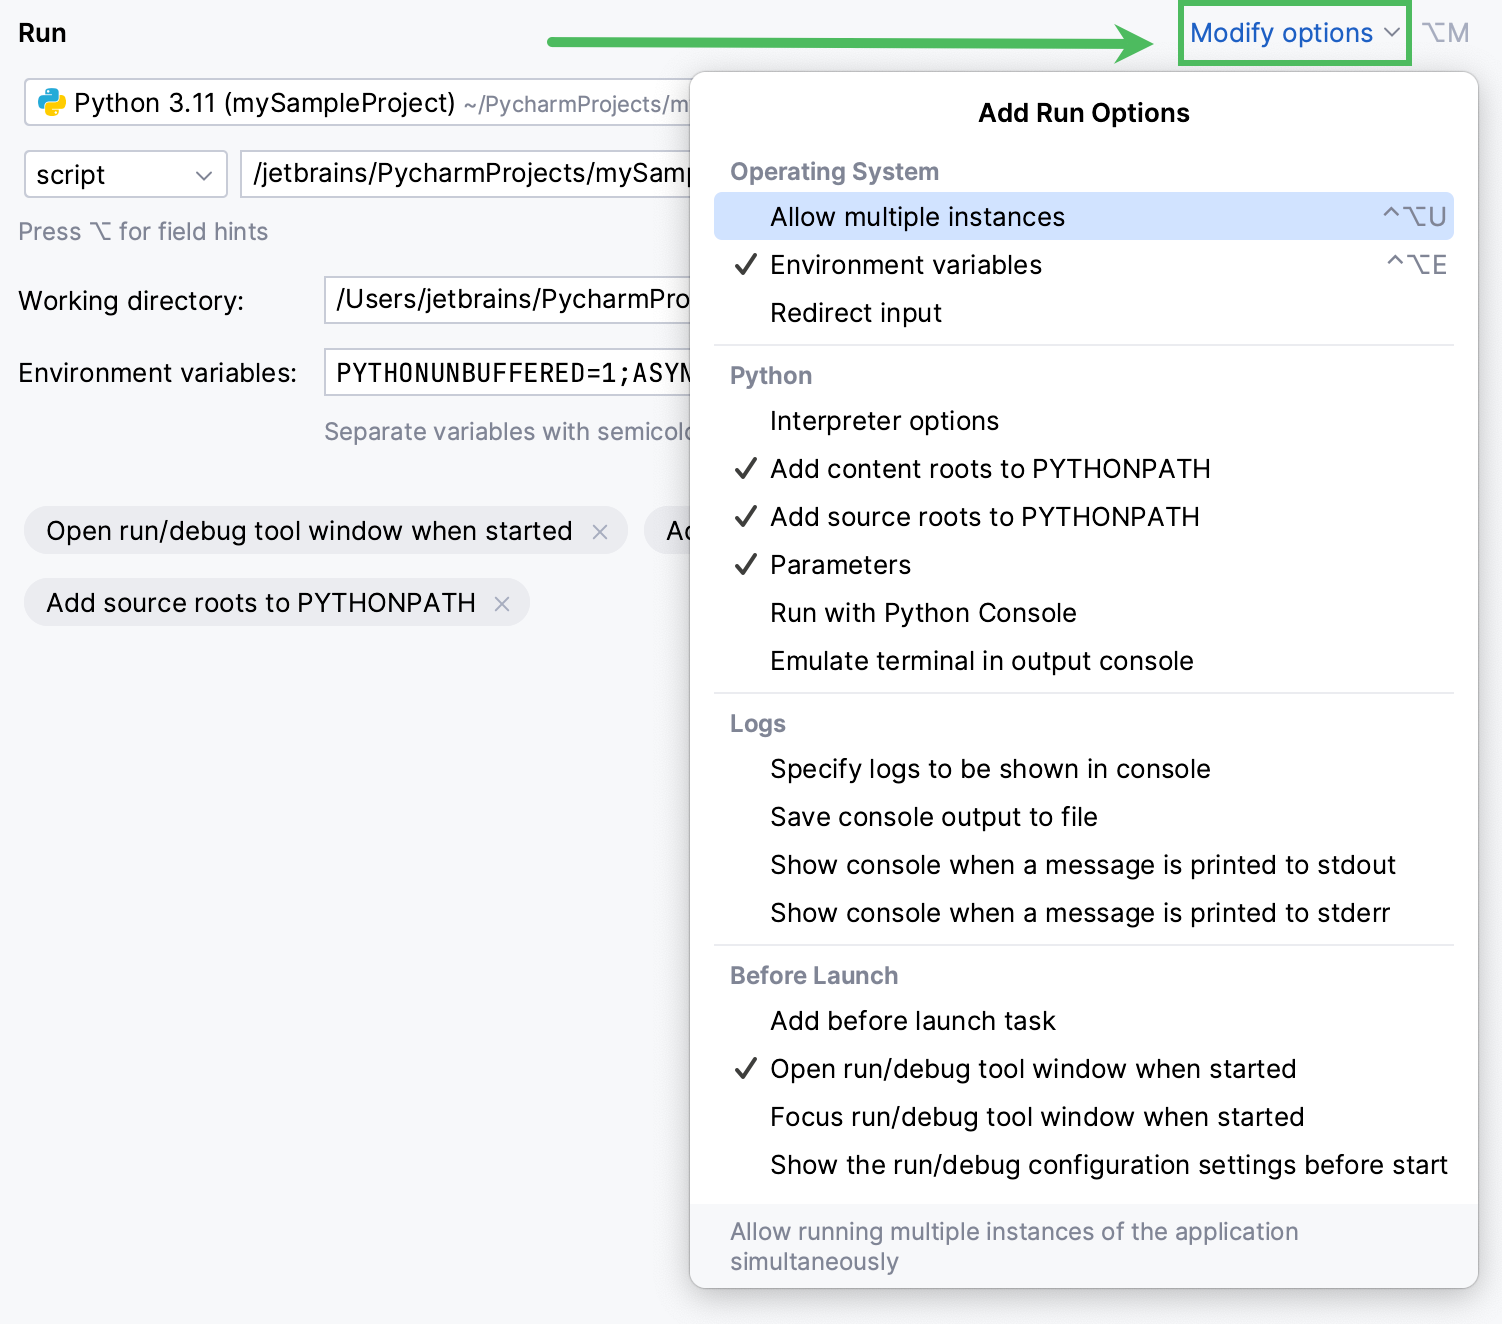
Click Modify options and select Specify logs to be shown in the console.
In the Logs section, click the Add button
 . The Edit Log Files Aliases Dialog opens.
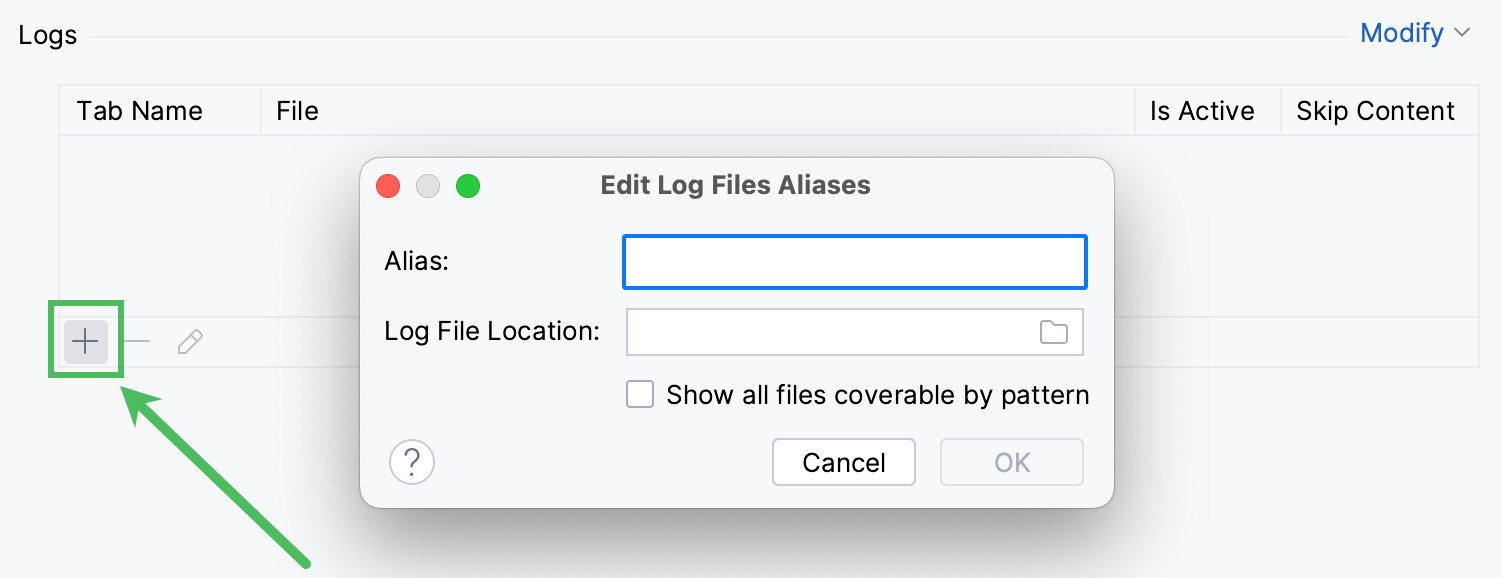
In the Alias field, type the alias for the log entry.
In the Log File Location field, specify the log files to display during running or debugging. You can specify the files by using two options:
Specify the full path to a specific file. Type the path manually or click the Browse button
 and select the file.
Specify the base directory and add an Ant pattern that defines the fileset to be displayed.
(Optional) Select the Show all files coverable by pattern checkbox to open a separate tab for each log file that matches the specified Ant pattern.
Click OK.
In the Edit Log Files Aliases table, select the Is Active checkbox to have the log entries displayed in the corresponding tabs in the Run tool window or Debug tool window.
To skip the previous content of the selected log, select the checkbox in the Skip Content column.
View logs in the Run tool window
When you run or debug the configuration, each active log opens in a separate tab of the Run or Debug tool window, next to the Console tab. The tab has the name that you specified in the Alias field.
Show log messages of a specific severity
Hover over the log tab and click
 Show Log Filter in its upper-right corner.
In the list, select which messages to show:
all: all messages.
infos: errors, warnings, and info messages.
warnings: errors and warnings. This is the default option.
errors: errors only.
Optionally, to show only the lines that contain specific text, type the text in the field next to the list.
PyCharm detects the severity of a line by the first of the following strings that occurs in it, in any letter case: error or fatal, warn, info, and debug. A line without these strings gets the severity of the last line above it that has one, so the lines of a multi-line message, such as a traceback, stay together. The filter settings apply to all log tabs in the project.
Set the log level of the console output
The severity filter is available only in log tabs. The Console tab shows everything that your program prints to the standard output and error streams, so the log level of the console output depends on the logging configuration of your program.
For example, the Python logging module prints only messages of the WARNING level and higher by default, and it prints them to the standard error stream, which the console shows in red. To show all messages, including debug messages, set the level in your code:
To filter the log messages of your program by severity in PyCharm, write them to a file and add the file to the run/debug configuration. For example, logging.basicConfig(filename="app.log", level=logging.DEBUG) writes all messages to app.log.